Every summer we vacation on Bustins Island in Casco Bay, Maine. Although it’s a heavenly place, getting there can be a bit of a challenge: it is, most assuredly, a labor of love.
This is because you can get to Bustins only by boat, and you have to take everything you will need with you, as there are no services on the island. No stores, no restaurants, no hotels, no cars, no power lines….nada, nuttin’, zilch, zero. If you can think of it, this island doesn’t have it.
My mother-in-law, who has been going to the island since she was a young girl, has the transporting of provisions there down to a science. Her secret? The banana box.
Banana boxes have a simple rectangular shape and are made out of very sturdy, coated (thus moisture-resistant) cardboard. They have built-in handles on the sides, and (since the flaps don’t meet, as regular cardboard-box flaps do) there is a big open space on the top. You can stack the boxes without crushing their contents, and when they are empty they can be recycled.
I suppose that when you consider the approximately 420 billion — that’s billion with a “b”–bananas shipped throughout the world each year, you realize that the design had better be good.
For us, at any rate, it’s just perfect. We can fit tons of the stuff we’re taking to the island into these babies: food, clothes, books, games; and we can glimpse through the top what’s inside each one. Because we can see at least some of the contents of each, we can make fast, sensible decisions about how to stack them (eggs on top, books on the bottom), and which ones look too heavy to carry (that’s what husbands and sons are for). We can also decide “at-a-glance” where each box needs to go once we arrive (kitchen, bedroom, etc.).
In short, banana boxes make getting to the island more efficient and less tiring, which allows
me to spend more time in the hammock where my mind can wander…to subjects like what kinds of boxes we can use to encode and display information in box plots (c’mon, it’s not THAT much of a stretch!).
Like the banana box, graphical boxes that encode data in graphs have an efficient rectangular shape, making it easy for people to see and compare a lot of information “at-a-glance,” thereby empowering people to gain insights and make informed decisions.
The graphs that use boxes to encode values are called box plots, or box-and-whisker plots, and although they look similar to bar charts, they are very different. A bar chart encodes and displays a single value; a box plot features a range of values from lowest to highest, and allows you to compare the distribution of those values to other value ranges and distribution.
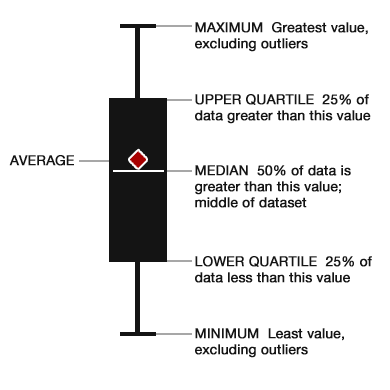
The following box-and-whisker plot diagram (created by John W. Tukey) illustrates the clarity and efficiency of this data-visualization technique.
Now consider the following graph showing the range of values and distribution of patients arriving at a hospital’s emergency department (ED) by time of day.
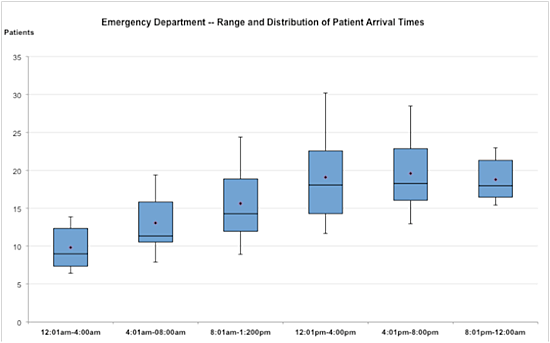
The box-and-whisker structure makes it clear at a glance that as the day goes on, more patients arrive at the ED, with the highest intake during the afternoon and evening hours. This presentation lets the viewer say, quickly and decisively,
The ED’s busiest times are from noon to midnight, when the average intake is 19, with a variance of 11 — 30 or so. The widest variation is from noon to about 4:00PM. From about 8:00PM to midnight, there is a pretty consistent average of 18 — 19 patients.
From this clear, precise perception, good questions and in-depth analysis (type of patient,
method of delivery, what percentage are admitted, staffing levels required) can flow.
As you can see, box plots are a terrific way to compare the distributions of different sets of
values. For reasons I’ve never been able to pin down, however, organizations don’t use them as often as they could, so most people (with the exception of statisticians) are not as familiar with them as they should be. Knowing this, I encourage you to begin to use them, adding only this last piece of advice: carefully familiarize your audience with them first. One easy way is to include a simple diagram, like the one shown above, the first few times you use a box plot to display information. The result will be more interest in and action on your report.
Like the banana box, a box plot is a simple yet powerful tool, with a truly great design-a universally beautiful thing that stands the test of time. Just ask my mother-in-law-or better yet, ask the people who will distribute 420 billion bananas this year. That’s a monkey’s paradise of a bunch of bananas.


0 Comments